特征," /> 特征,"/> 山东短历时年最大降水分布和变化特征

山东科学

• 环境与生态 •    

山东短历时年最大降水分布和变化特征

环海军1,刘 岩1,葛瑞婷1,邱粲2*   

  1. 1.山东省淄博市气象局,山东 淄博,2550482.山东省气候中心,山东,济南,250031
  • 收稿日期:2025-03-21 接受日期:2025-04-23 上线日期:2026-02-05
  • 通信作者: 邱粲 E-mail:qcqyw@hotmail.com
  • 作者简介:环海军(1987-),高级工程师,研究方向为气候应用和应用气象研究。E-mail:zbqxjhhj@163.com
  • 基金资助:
    山东省气象局科研项目(2023SDBD02,2023sdqxz04);环渤海区域科技协同创新基金项目(QYXM202206)

Distribution and variability of annual maximum short-duration precipitation in Shandong province

HUAN Haijun1, Liu Yan1, Ge Ruiting1, Qiu Can2*   

  1. 1. Zibo Meteorological Bureau of Shandong province, Zibo 255048, China; 2. Shandong Provincial Climate Center, Jinan 250031, China
  • Received:2025-03-21 Accepted:2025-04-23 Online:2026-02-05
  • Contact: Qiu Can E-mail:qcqyw@hotmail.com

摘要: 
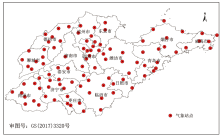
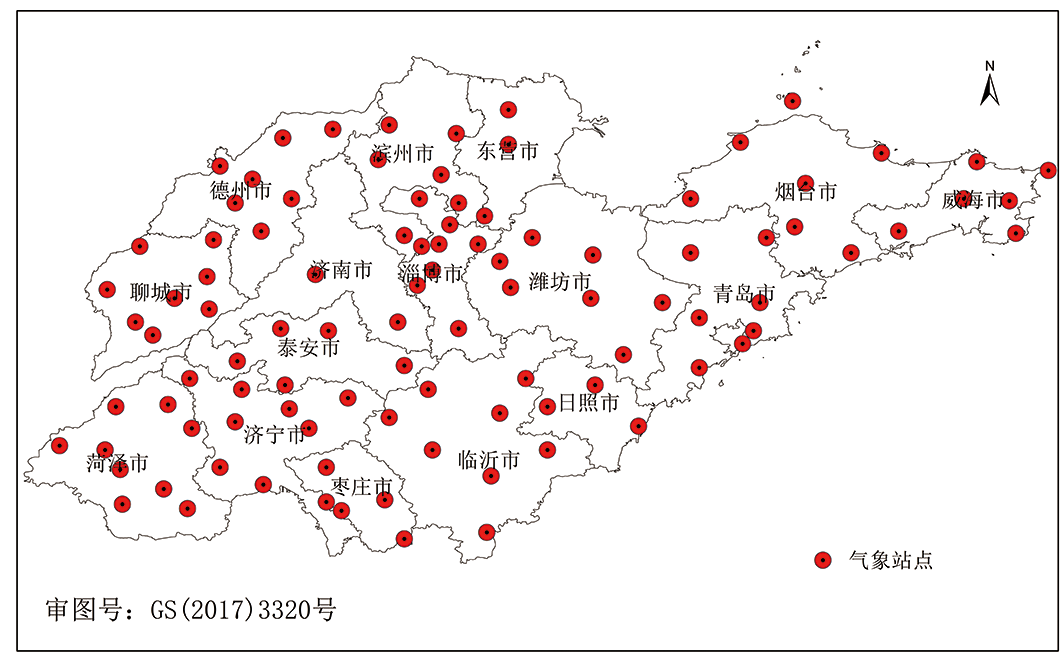
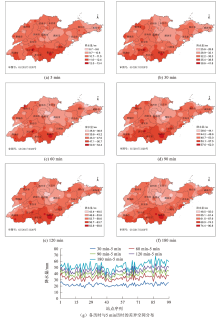
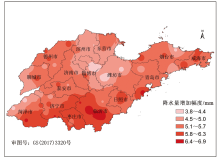
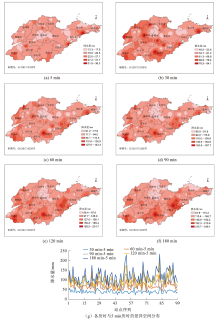
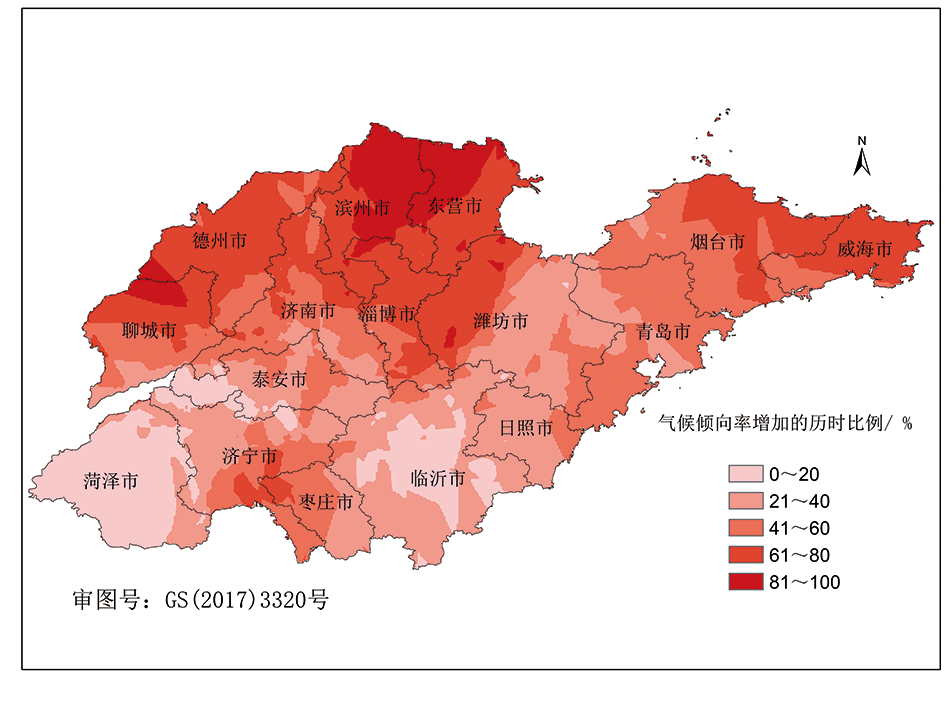
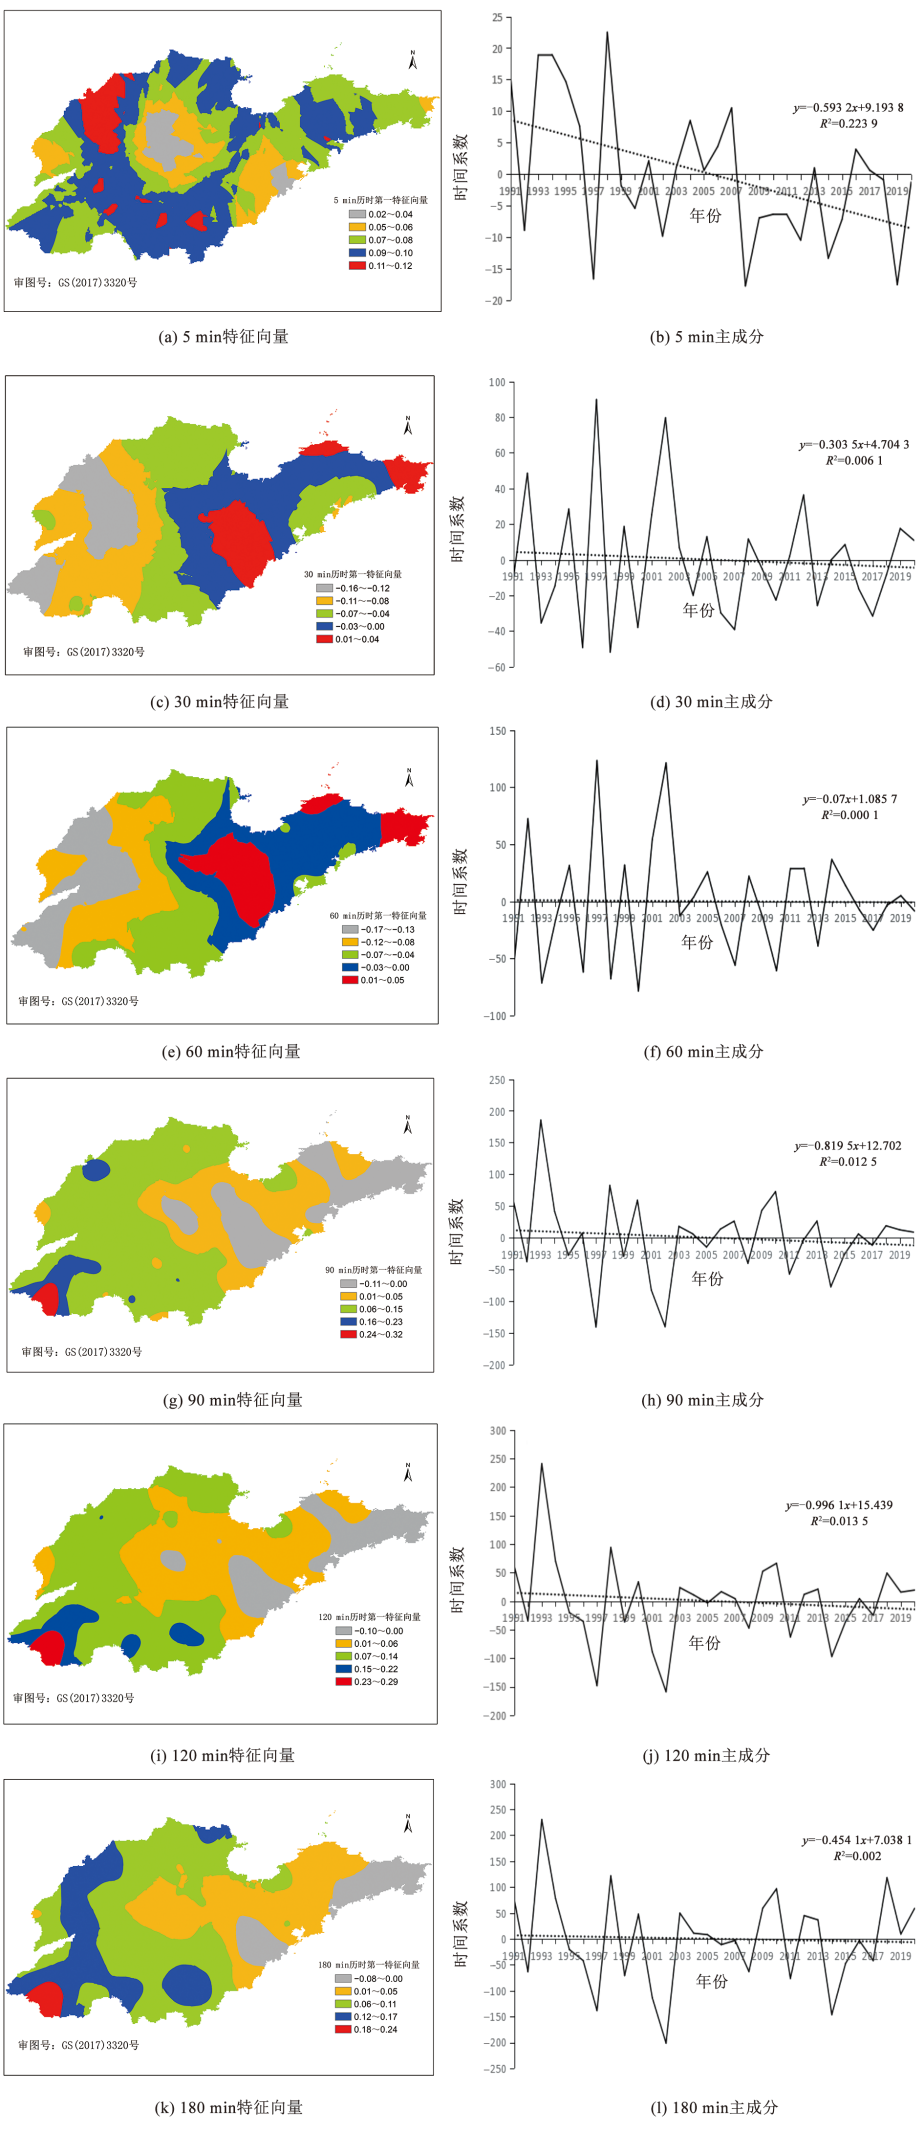
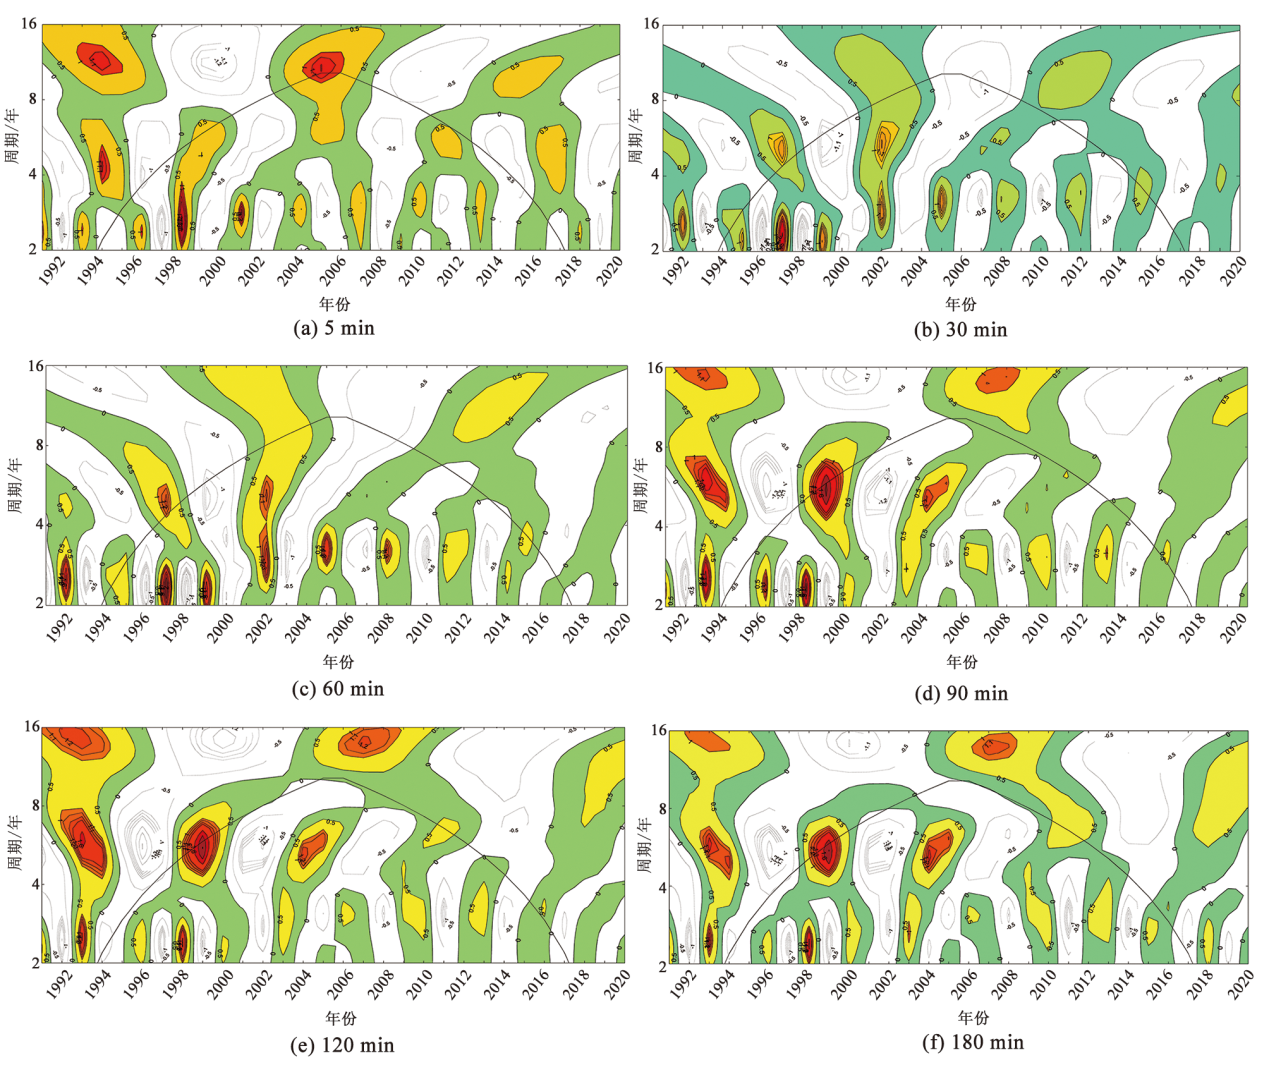
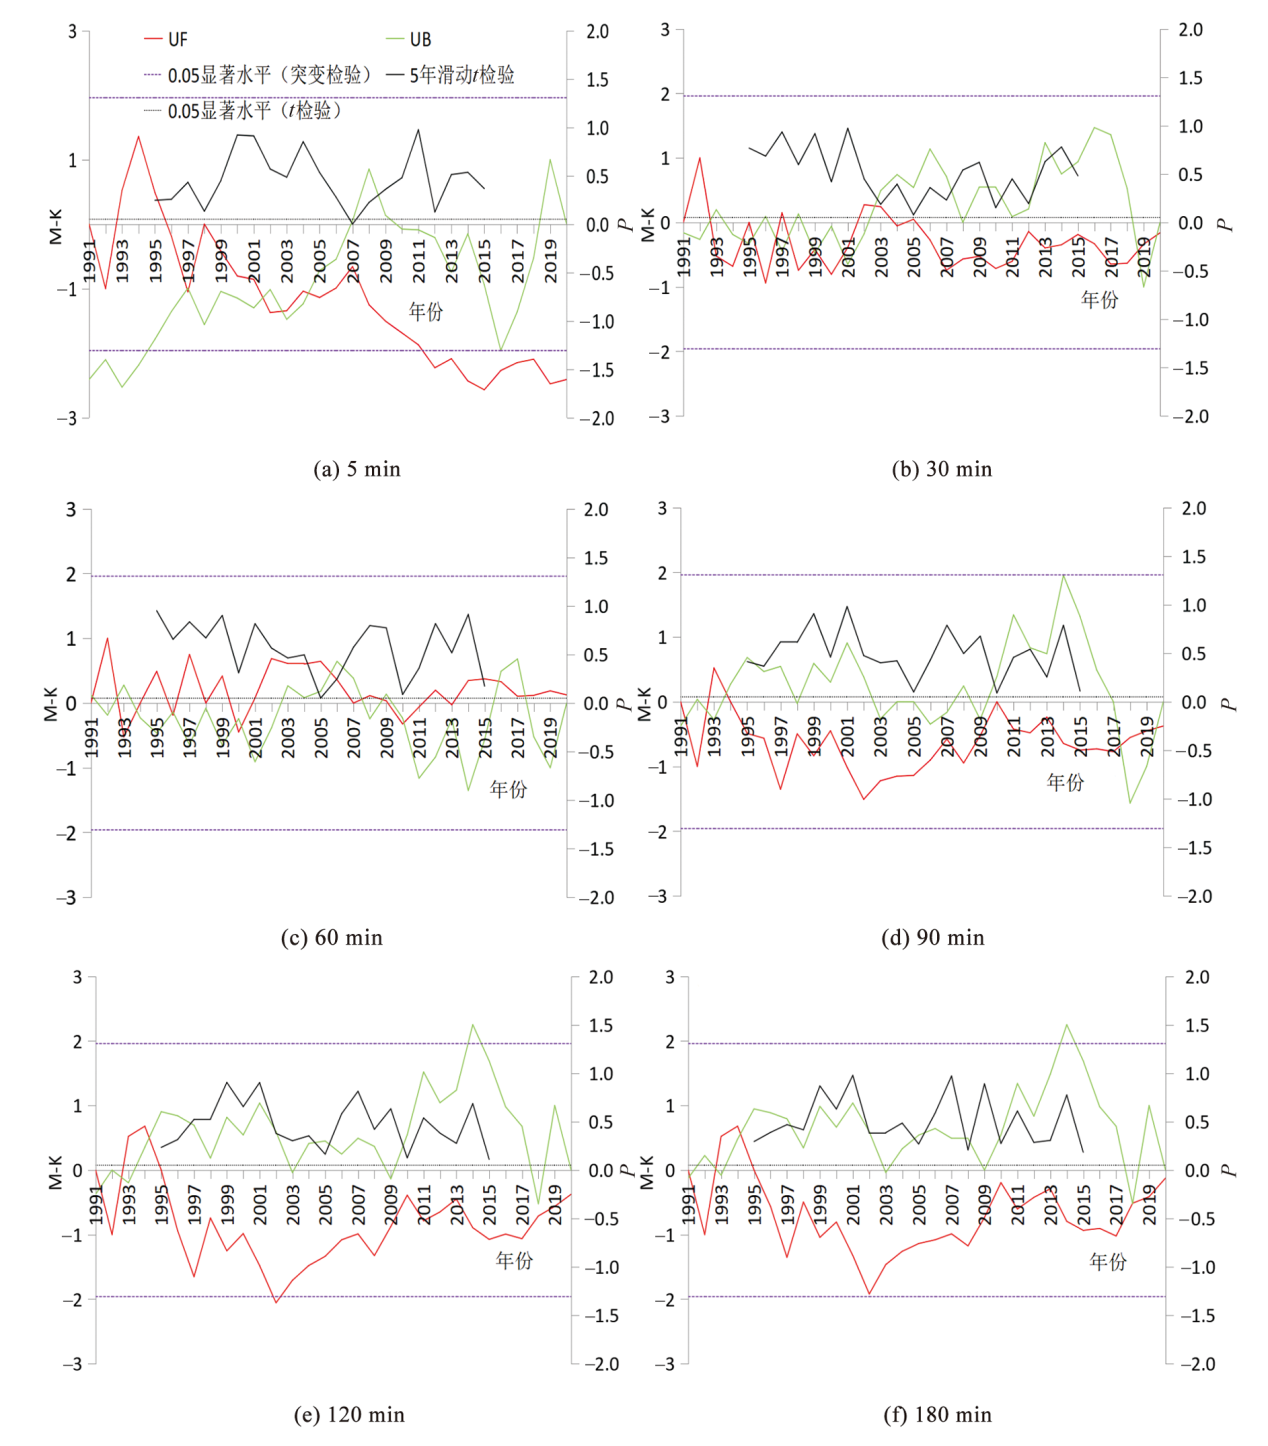
近年来山东极端降水事件频发,为加强短历时极端降水事件监测预报预警,基于山东99个国家气象站1991—2020年逐分钟降水数据,通过气候倾向率、小波分析和经验正交分解等时空分析方法,得出不同短历时年最大降水分布和时空变化特征。结果表明:山东不同短历时年最大降水平均值及最大值由鲁中中东部向四周递增,最大值在鲁南地区;鲁南多数地区各短历时年最大降水随时间变化呈减少趋势,其它地区多数历时呈增加趋势;5 min历时空间变化趋势一致,强度中心在鲁西北中部,30 min60 min历时鲁南东部、半岛东部与其他区域呈相反的变化趋势,负强度中心在鲁中西部、鲁西北西部和鲁南西部,90 min120 min180 min历时鲁中东部、半岛中东部与其他区域呈相反的变化趋势,正强度中心在鲁南西部,各历时有2~3 a的显著周期,5 min历时在2004年发生突变后显著减少,其它短历时无突变年份。山东多数短历时降水年最大降水呈增加趋势,要重点关注鲁南和鲁西北极端降水事件监测和暴雨强度公式修订。

关键词: 山东省, 短历时, 年最大降水, 特征')">时空变化特征

Abstract: In recent years, extreme precipitation events have become increasingly frequent in Shandong Province. To improve the monitoring, forecasting, and early warning of these short-duration events, this study analyzes minute-level precipitation data from 99 national meteorological stations in Shandong Province, covering the period from 1991 to 2020. Using the climate tendency rate, wavelet analysis, and empirical orthogonal function decomposition, we examine the spatiotemporal distribution and variability of annual maximum precipitation across different short durations. The results indicate that both the average and maximum values of annual maximum precipitation for all short durations increase progressively from central and eastern Shandong outward, peaking in southern Shandong. In most parts of southern Shandong, these annual maxima show a decreasing trend over time, whereas most other areas exhibit an increasing trend. For 5-min durations, the spatial variability trends are generally consistent, with intensity centers located in northwestern Shandong. For the 30-min and 60-min durations, eastern and southern Shandong, as well as the eastern Shandong Peninsula, show trends opposite to those in other regions, with negative intensity centers in central-western, northwestern, and southwestern Shandong. For the 90-min, 120-min, and 180-min durations, the eastern central region and the eastern Shandong Peninsula display opposite trends, with positive intensity centers in southwestern Shandong. Each duration shows significant 2–3 year periodicities. An abrupt change was detected in 2004 for the 5-min duration, leading to a marked decrease thereafter, whereas no abrupt changes were observed for other durations. Overall, most annual maximum short-duration precipitation events in Shandong exhibit an increasing trend. These findings underscore the importance of enhancing monitoring efforts and revising storm intensity formulas, particularly in southern and northwestern Shandong.

Key words: Shandong Province, short duration, annual maximum precipitation, spatiotemporal variability

中图分类号: 

  • P467

开放获取 本文遵循知识共享-署名-非商业性4.0国际许可协议(CC BY-NC 4.0),允许第三方对本刊发表的论文自由共享(即在任何媒介以任何形式复制、发行原文)、演绎(即修改、转换或以原文为基础进行创作),必须给出适当的署名,提供指向本文许可协议的链接,同时表明是否对原文作了修改,不得将本文用于商业目的。CC BY-NC 4.0许可协议详情请访问 https://creativecommons.org/licenses/by-nc/4.0